Dividend Calculator logodividendcalculator.app

Dividend Reinvestment (DRIP) Calculator

See what reinvested dividends become and when they cover your bills

Portfolio value (today's $)
$587,124
≈ $1.23M nominal
Monthly income (today's $)
$3,016
run rate · ≈ $6,327 nominal
Yield on cost
10.4%
vs 3.5% starting yield
Total invested
$190,000
+ $538,024 after-tax dividends
2055 is your crossover year: dividends cover your $3,000/mo goal (today's dollars) in year 30 of your plan.
$100/mo · 2029$250/mo · 2034$500/mo · 2039$1k/mo · 2045$2.5k/mo · 2054

Monthly dividend income milestones (today's dollars)

Portfolio growth
What your portfolio is made of over time
ContributionsReinvested dividendsMarket growth

Projections assume smooth, constant rates. Real markets are volatile and dividend cuts happen. Nothing here is investment advice. Read the full methodology.

How this dividend reinvestment calculator works

The simulation runs month by month. Every deposit buys shares at the current price, and every share pays a dividend that grows once a year at the rate you set. Reinvested payouts buy more shares, which is the whole point of a DRIP. If the money sits in a taxable brokerage account, add a dividend tax rate in the advanced settings. Figures marked “today's dollars” are deflated by your inflation assumption, so a $3,000 monthly goal still buys $3,000 of groceries in 2056.

When will dividends cover your expenses? Set an income goal in the sidebar and the calculator marks the year your projected dividend income crosses it, measured in today's dollars rather than inflated future ones.
Why yield on cost keeps climbing

Put $10,000 into a fund yielding 3.5% and it pays about $350 the first year. If the fund raises its payout 7% a year, those same shares pay about $740 by year twelve, and reinvesting the dividends along the way pushes the income past $1,000. Yield on cost is this year's dividend divided by what the shares cost you, reinvested lots included, and it is the number this strategy is really about. The income chart usually bends upward long after the portfolio chart starts to look boring.

Choosing inputs you can defend

The presets are starting points, not forecasts. Broad index funds yield under 1.5% when I last checked, and quality dividend funds sit near 3.5%. Covered-call products advertise 8% or more, but their payouts rarely grow. Before leaning on a projection, look up a fund's current yield and its five-year dividend growth. When in doubt, nudge the growth rates down. An assumption that survives a bad decade beats an impressive spreadsheet.

What can go wrong

  • Dividends get cut. Payouts fell hard in 2008 and again in 2020, and a constant-growth model smooths right over that.
  • The highest yield on the screen is usually the riskiest. A payout the company can sustain matters more than this quarter's percentage.
  • Taxes and inflation change the answer more than most inputs. Check the projection in after-tax, today's-dollar terms before trusting it.
  • One stock is not a strategy. Spread the risk.

DRIP calculator FAQ

What is a DRIP?

A dividend reinvestment plan. Instead of paying you cash, each dividend buys more shares, and the new shares pay dividends of their own. The reinvestment slider above models anything from a full DRIP to taking every dollar as income.

How much do I need to invest to make $1,000 a month in dividends?

About $300,000 at a 4% yield, or $200,000 at 6%. Those figures assume you need the income today. If you can wait, dividend growth and reinvestment shrink the required stake every year you hold. Set the income goal above to $1,000 and the calculator shows the year your plan gets there.

What is a dividend crossover year?

The year your projected dividend income covers your target expenses. This calculator reports it in today's dollars, so inflation cannot flatter the result.

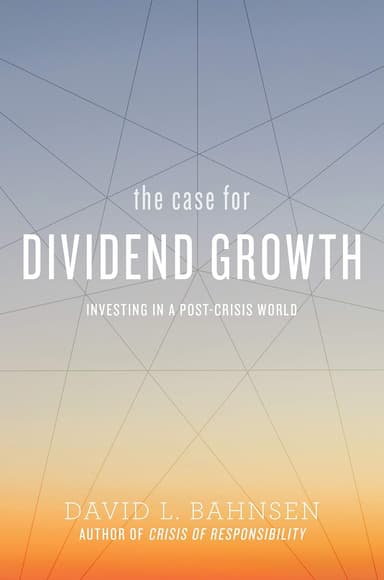
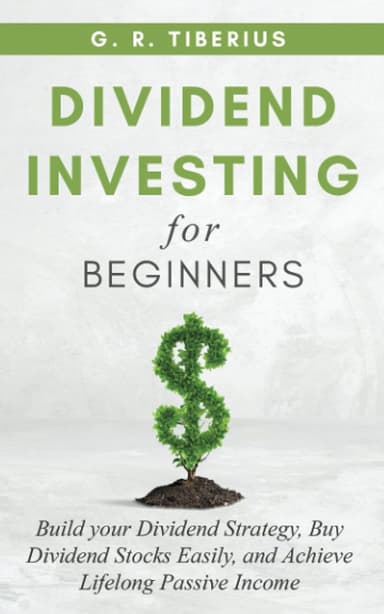
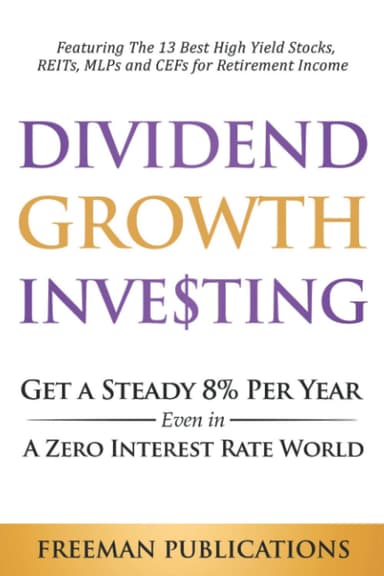
Recommended reading on dividend growth investing

Book links may earn this site a commission.